
Learn · Ephemeris
There's no way around it - this is a complex tool. By breaking down each part it should help to show how you can use this guide to work out where the sun will be when you visit each location.
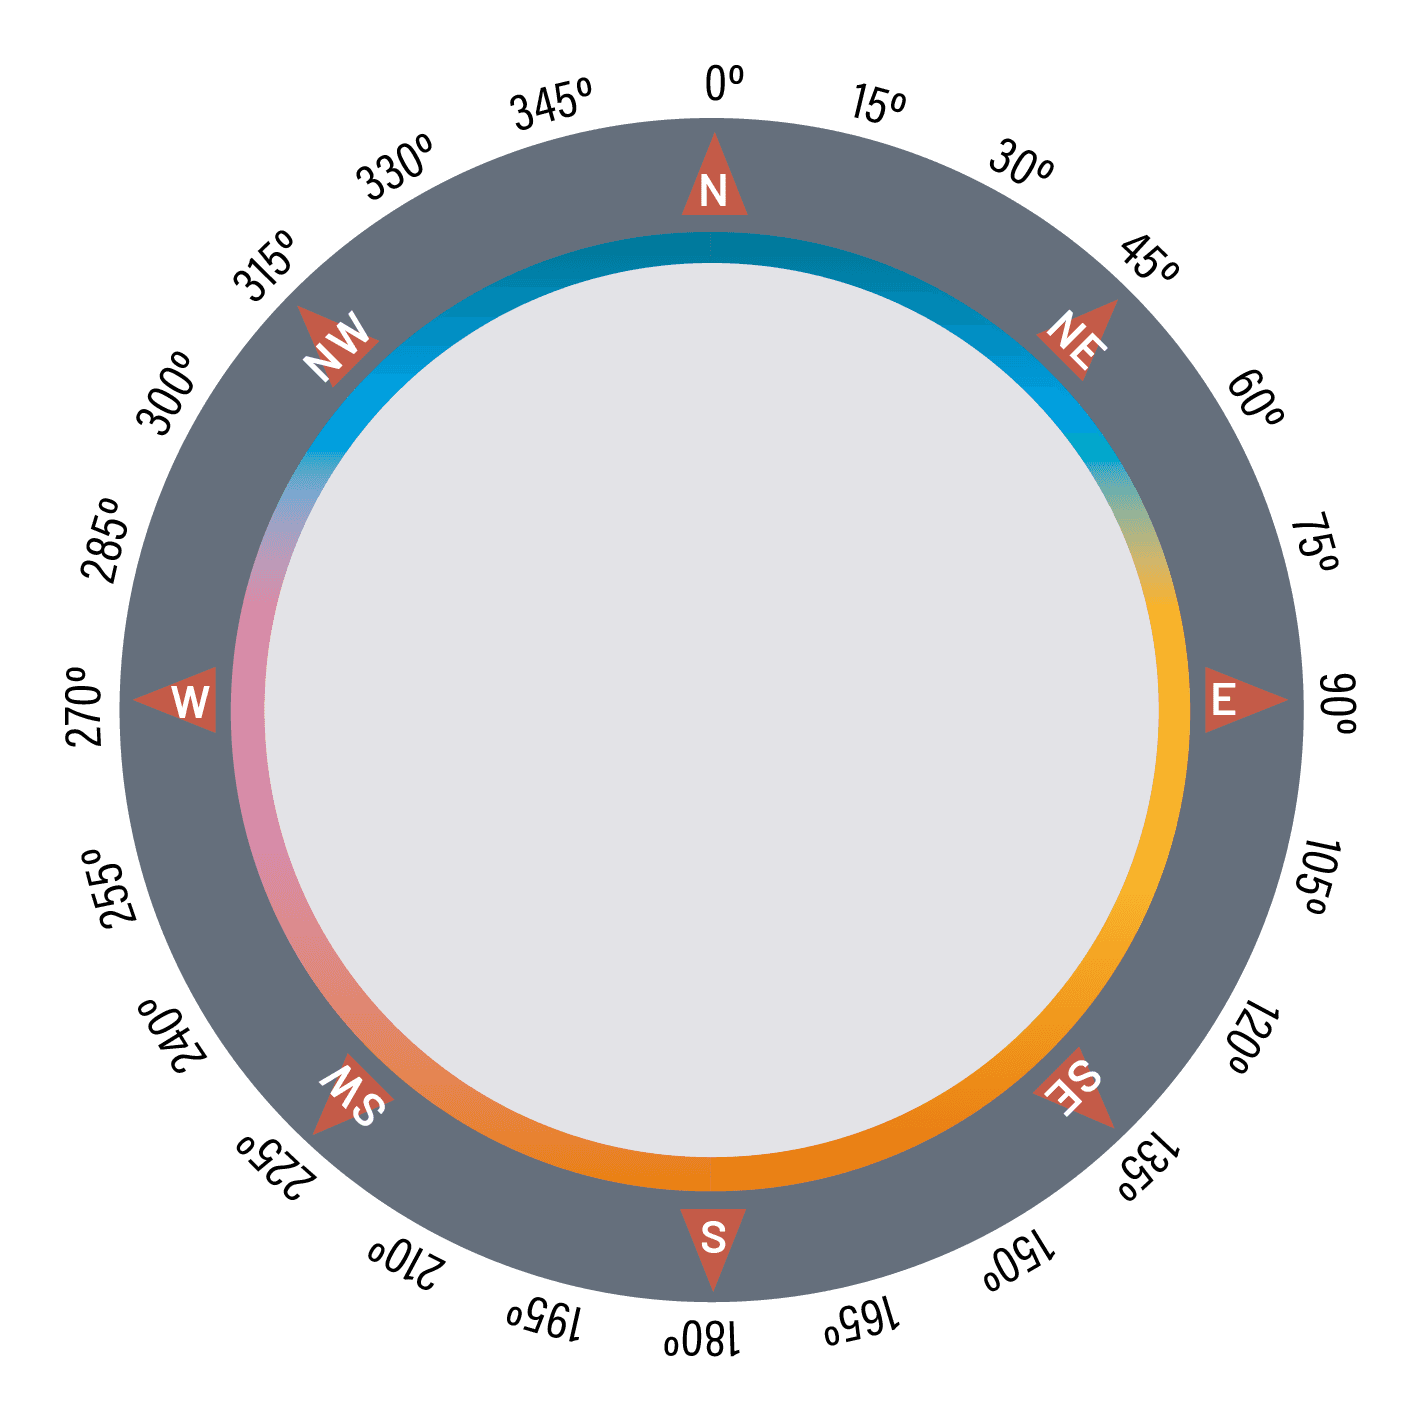
Simplifying the element
This graphic shows the angle of degrees of the sun at sunrise and sunset - like a compass!
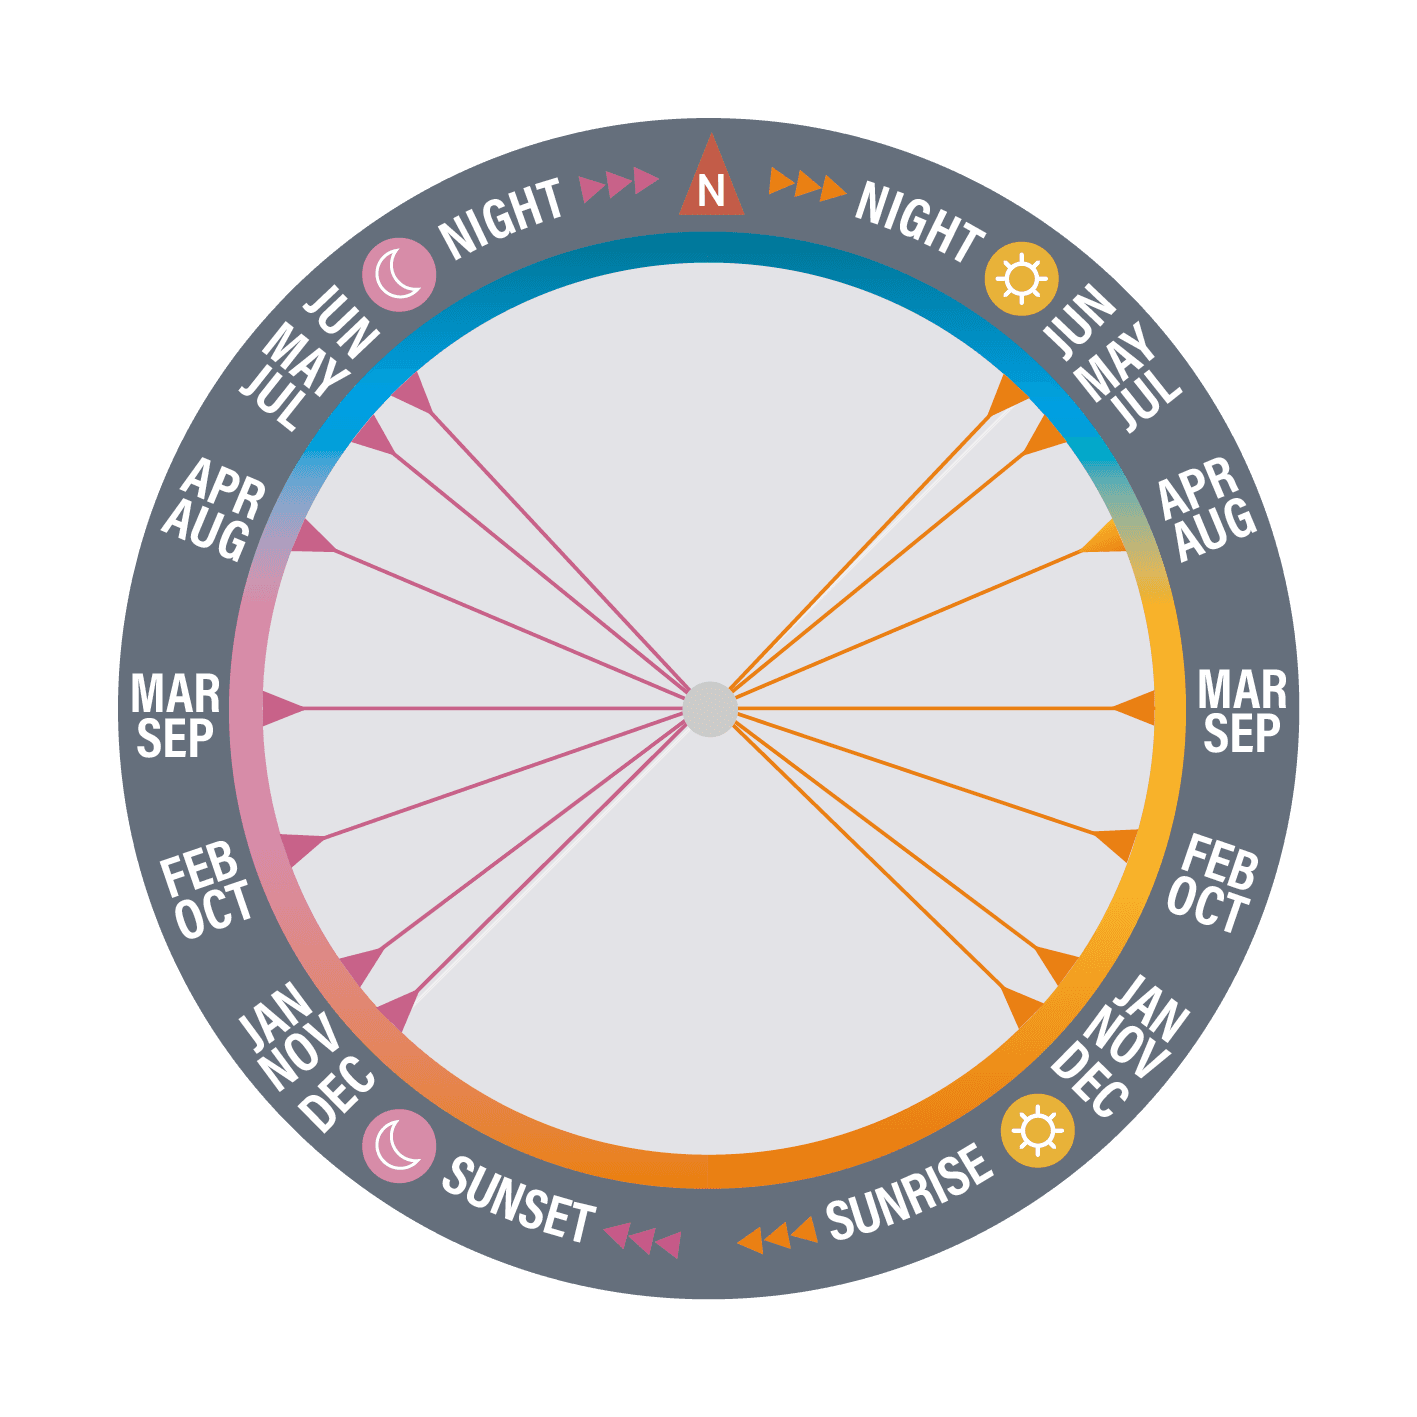
Sun direction
This shows the direction of angle of the sun at sunrise and sunset as it moves throughout the year, resulting in distinctly different lighting scenarios.
One of the beautiful things about landscape photography is knowing the combination of date, time, weather and tide presents infinite possibilities.
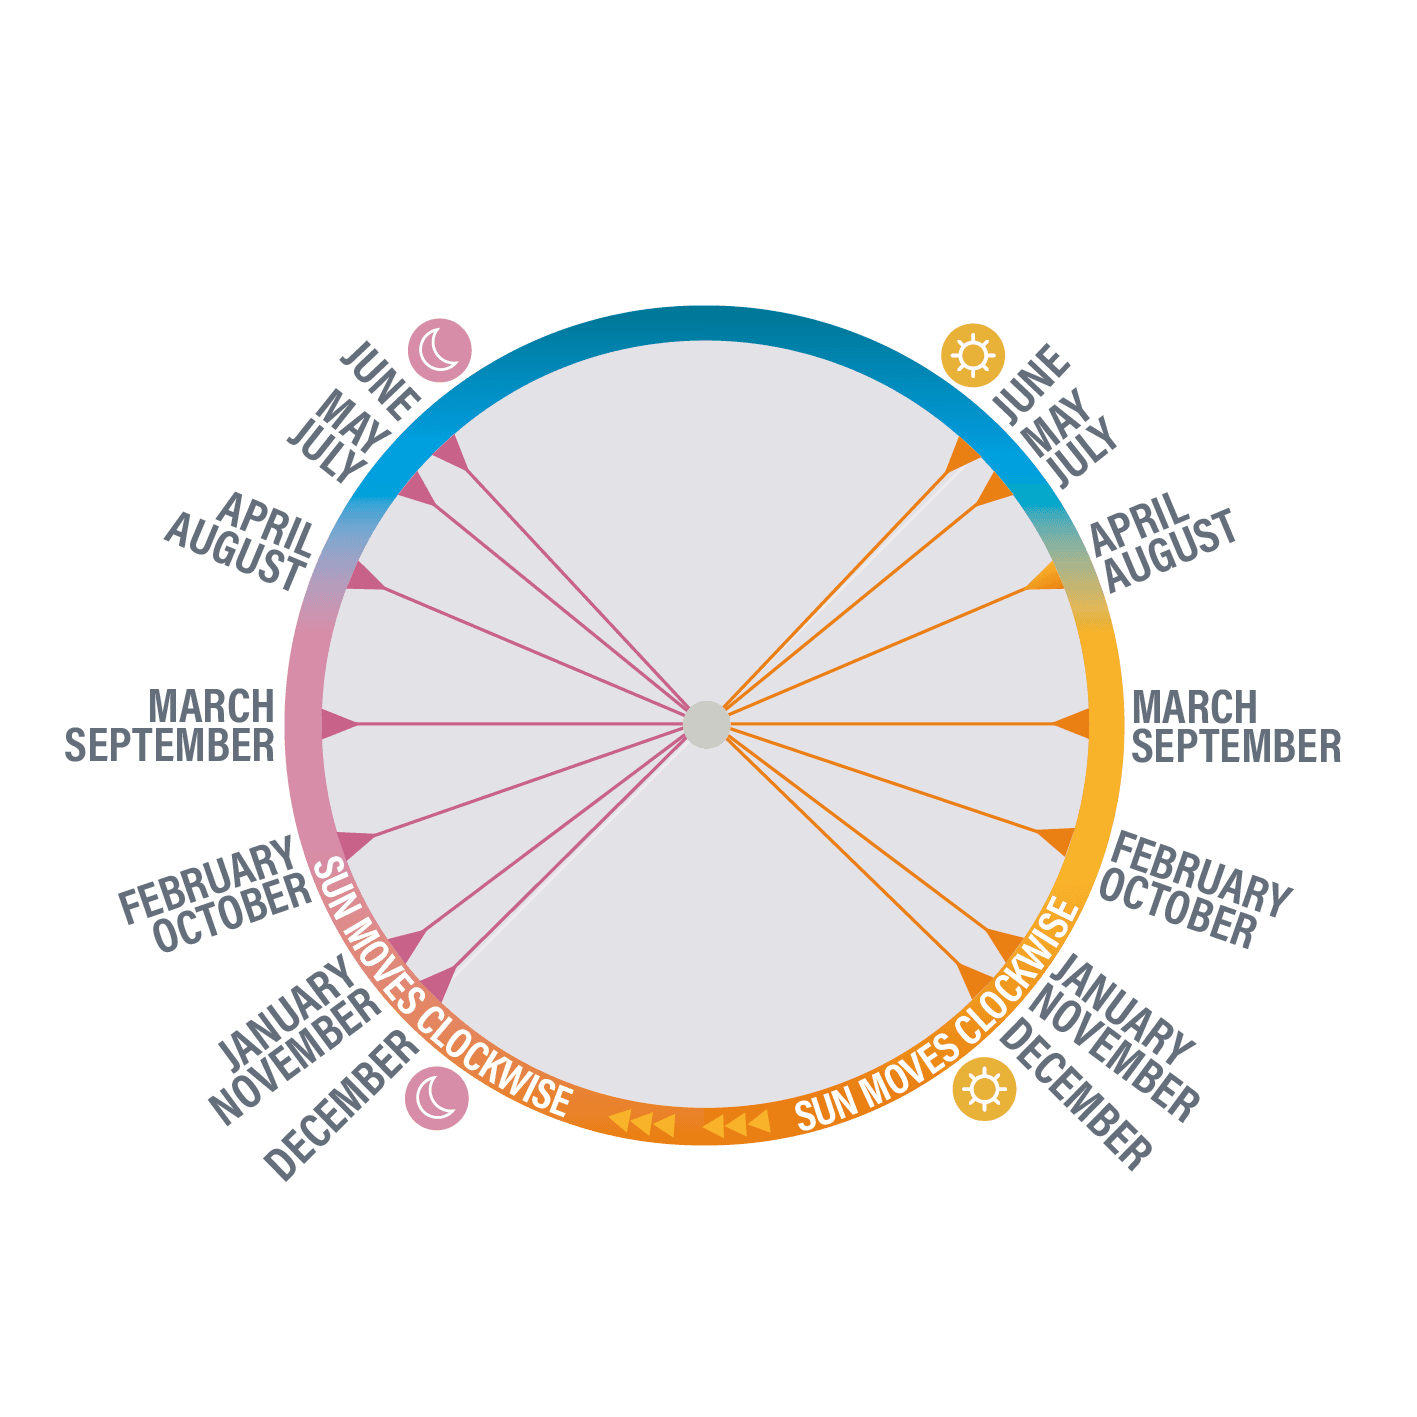
Months
This is the same element as above, shown a little differently to outline the months more clearly. The sun tracks further to the north for sunrise and sunset from December to June and back again. The sun moves clockwise on this chart from sunrise to sunset.
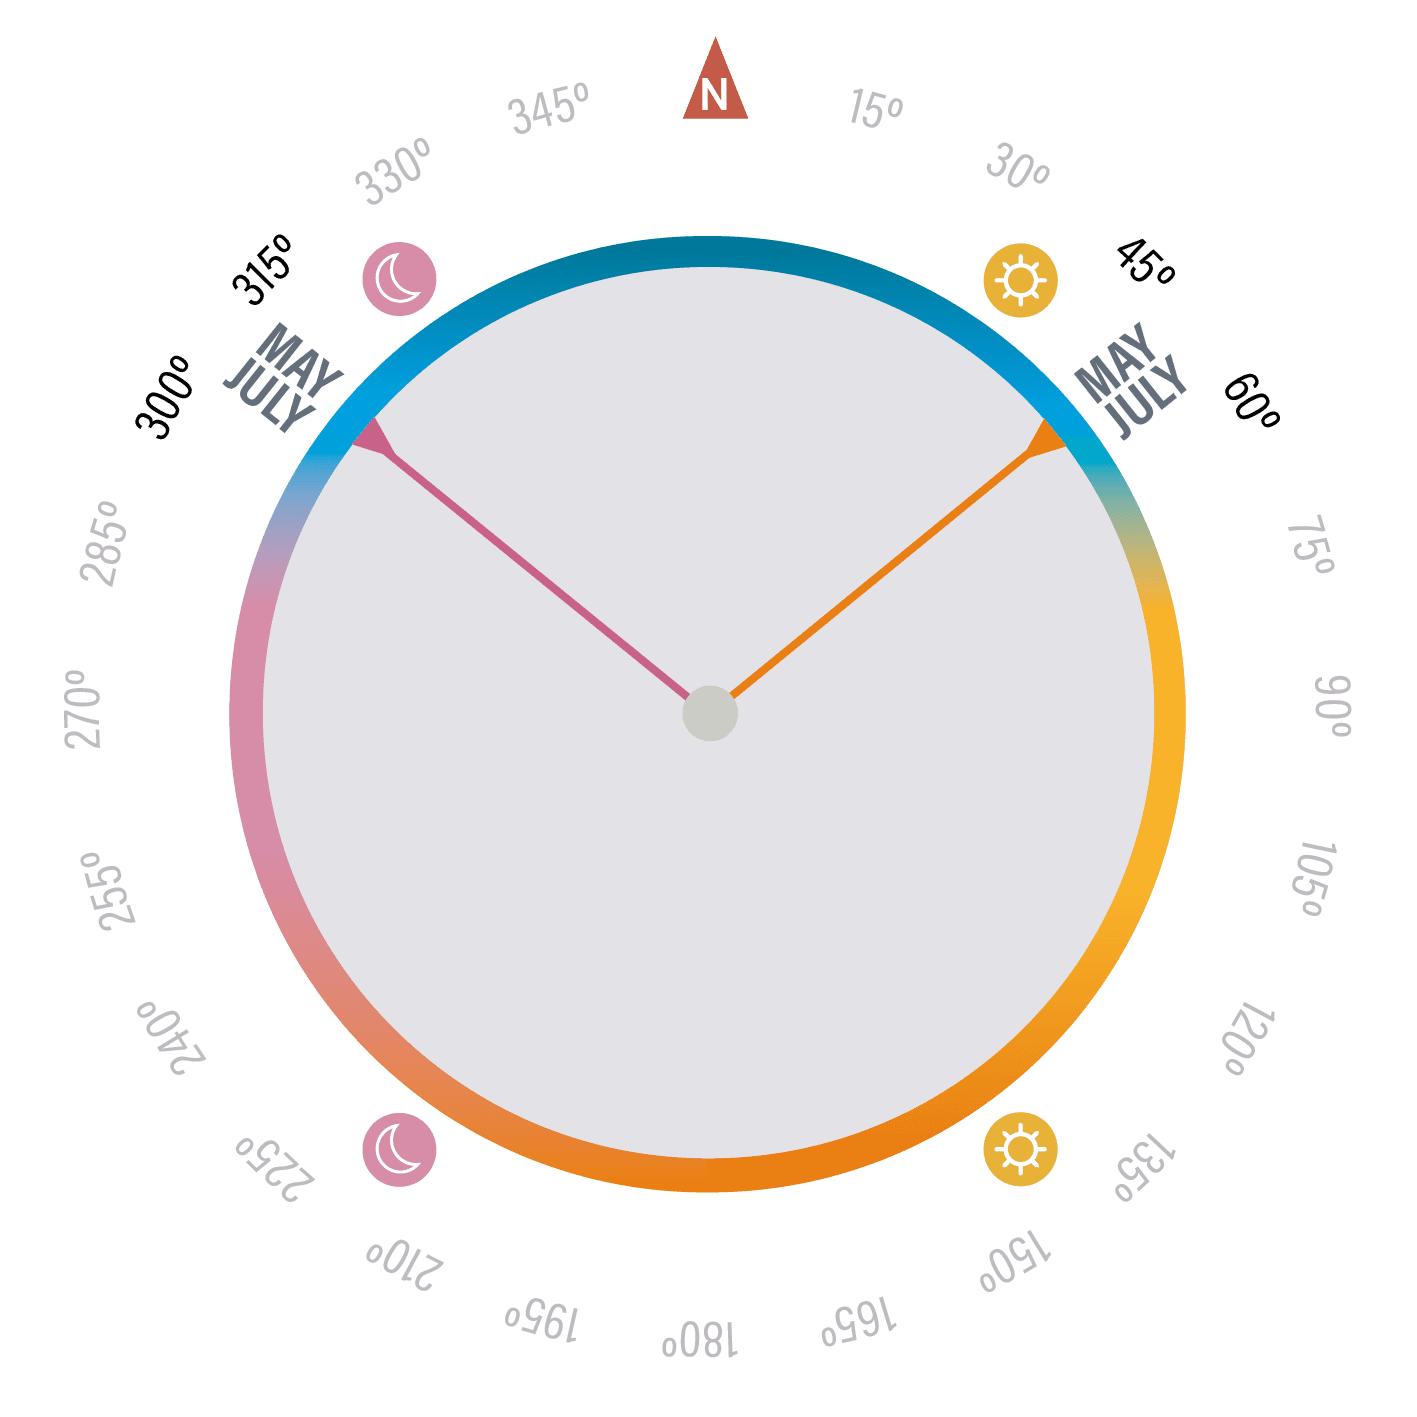
This diagram isolates the sun direction even further to look at the months of May and July (21st of month used for diagram). If we add the rotational degrees back in you can see the direction of the sun during the daylight hours.
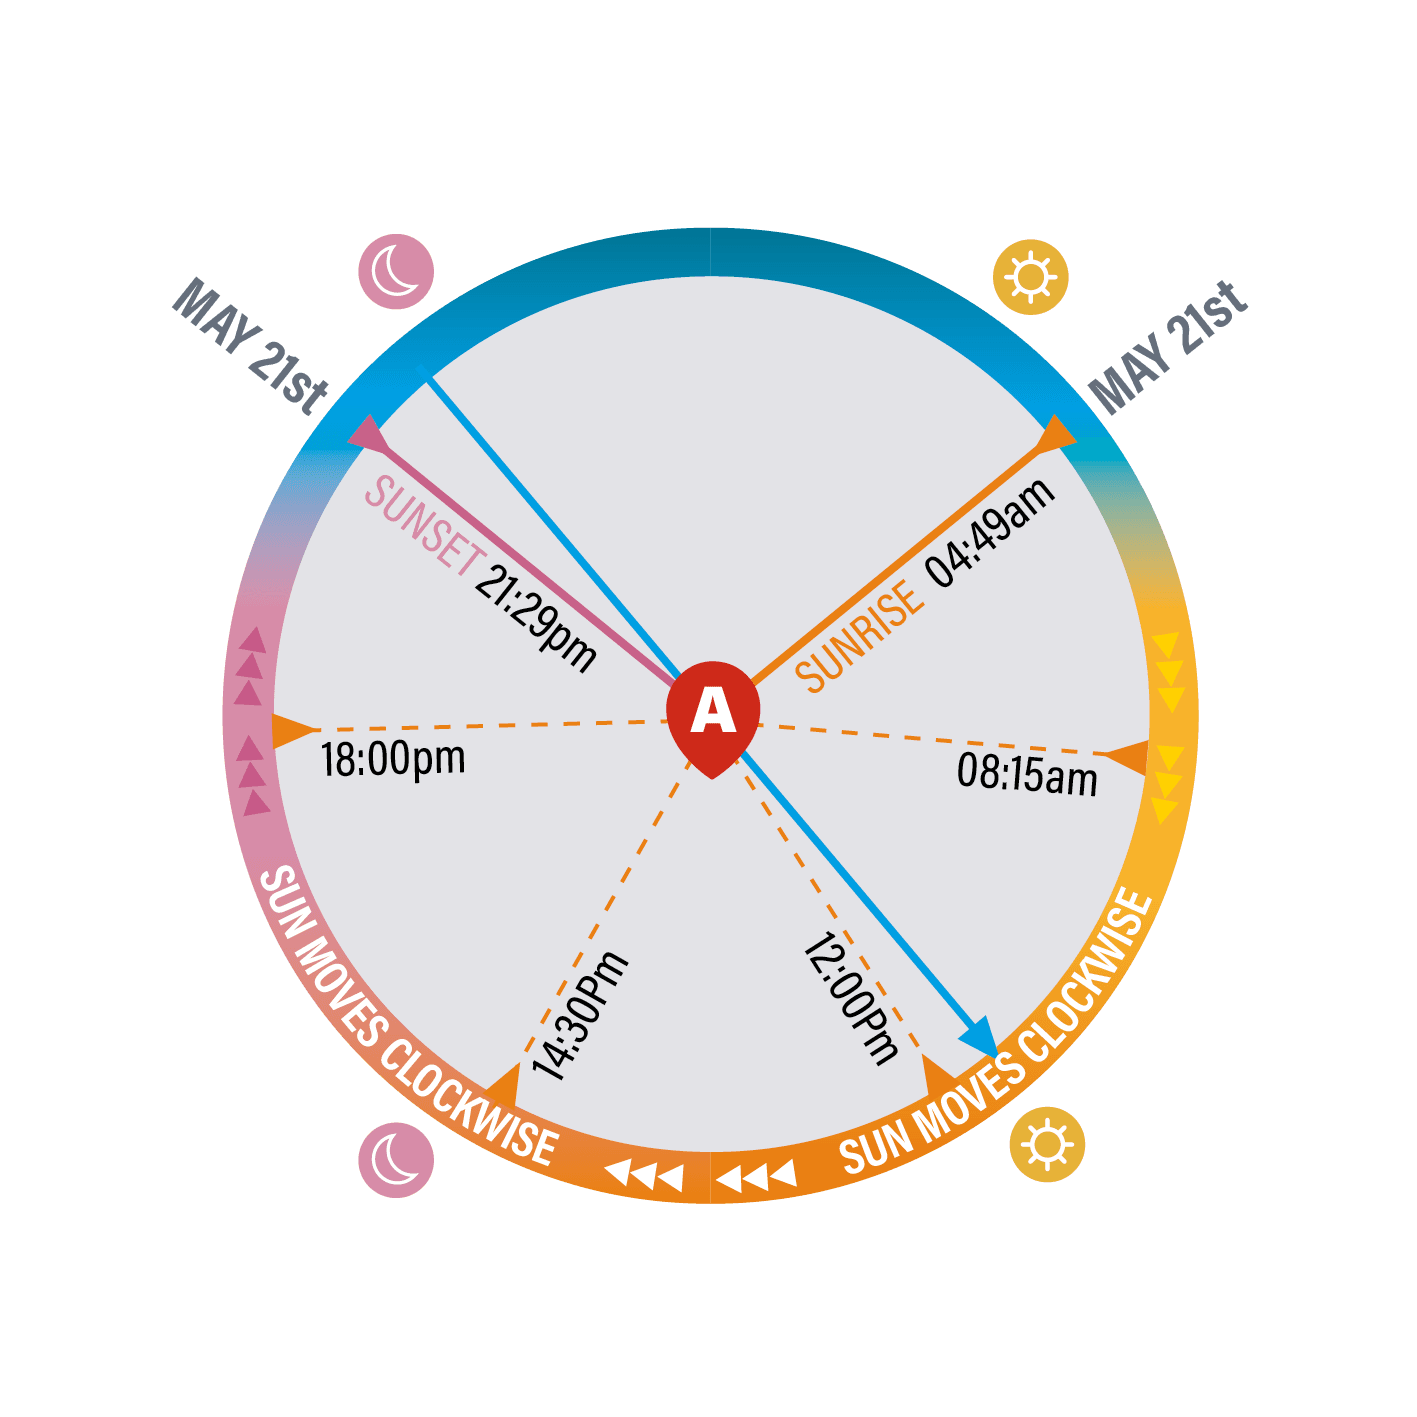
Adding in the direction the shot was taken shows us the sun in relation to the angle of the shot. This changes throughout the day as the sun rotates, which is shown here by adding in some times.
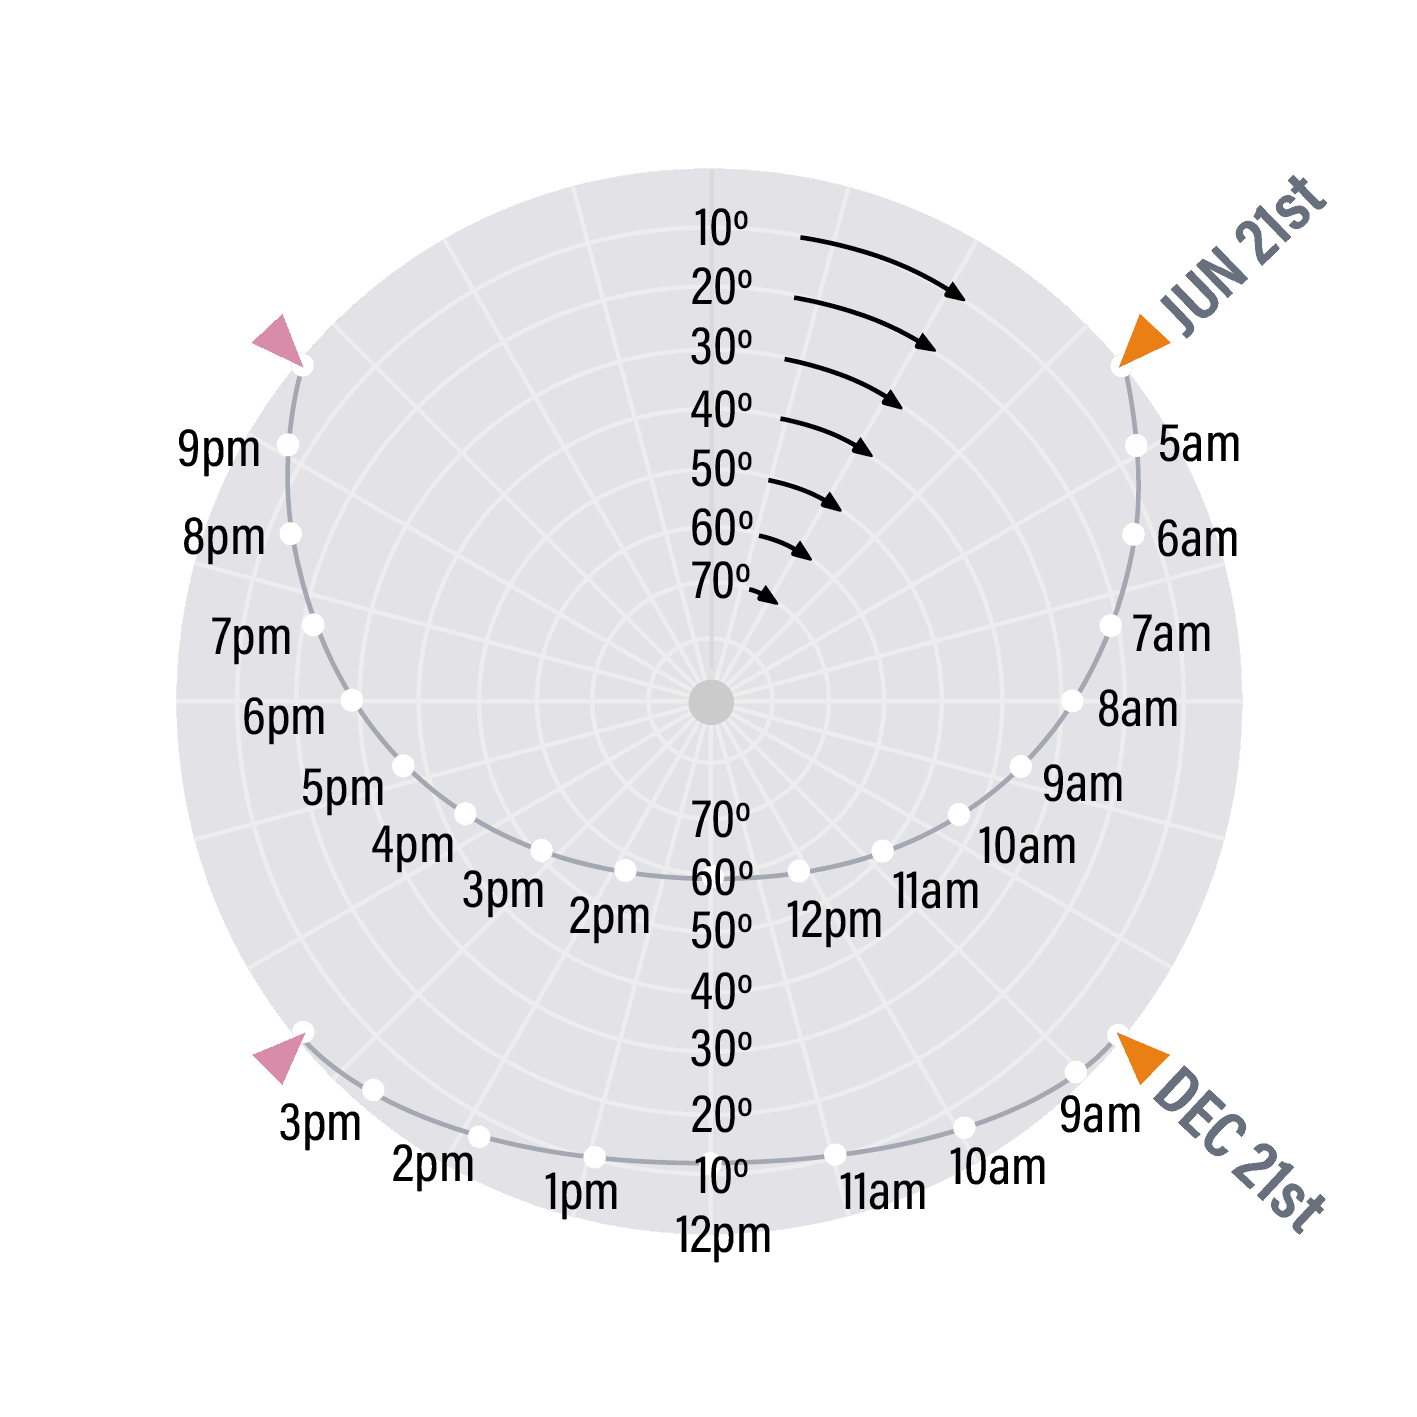
Adding in the angle of the sun adds another layer of complexity, but it really helps to be aware of the fact that the sun is significantly higher in the summer than it is in winter.
The ephemeris tool shows a sun height graph for each month with the daylight hours of the day plotted in white for June and December.
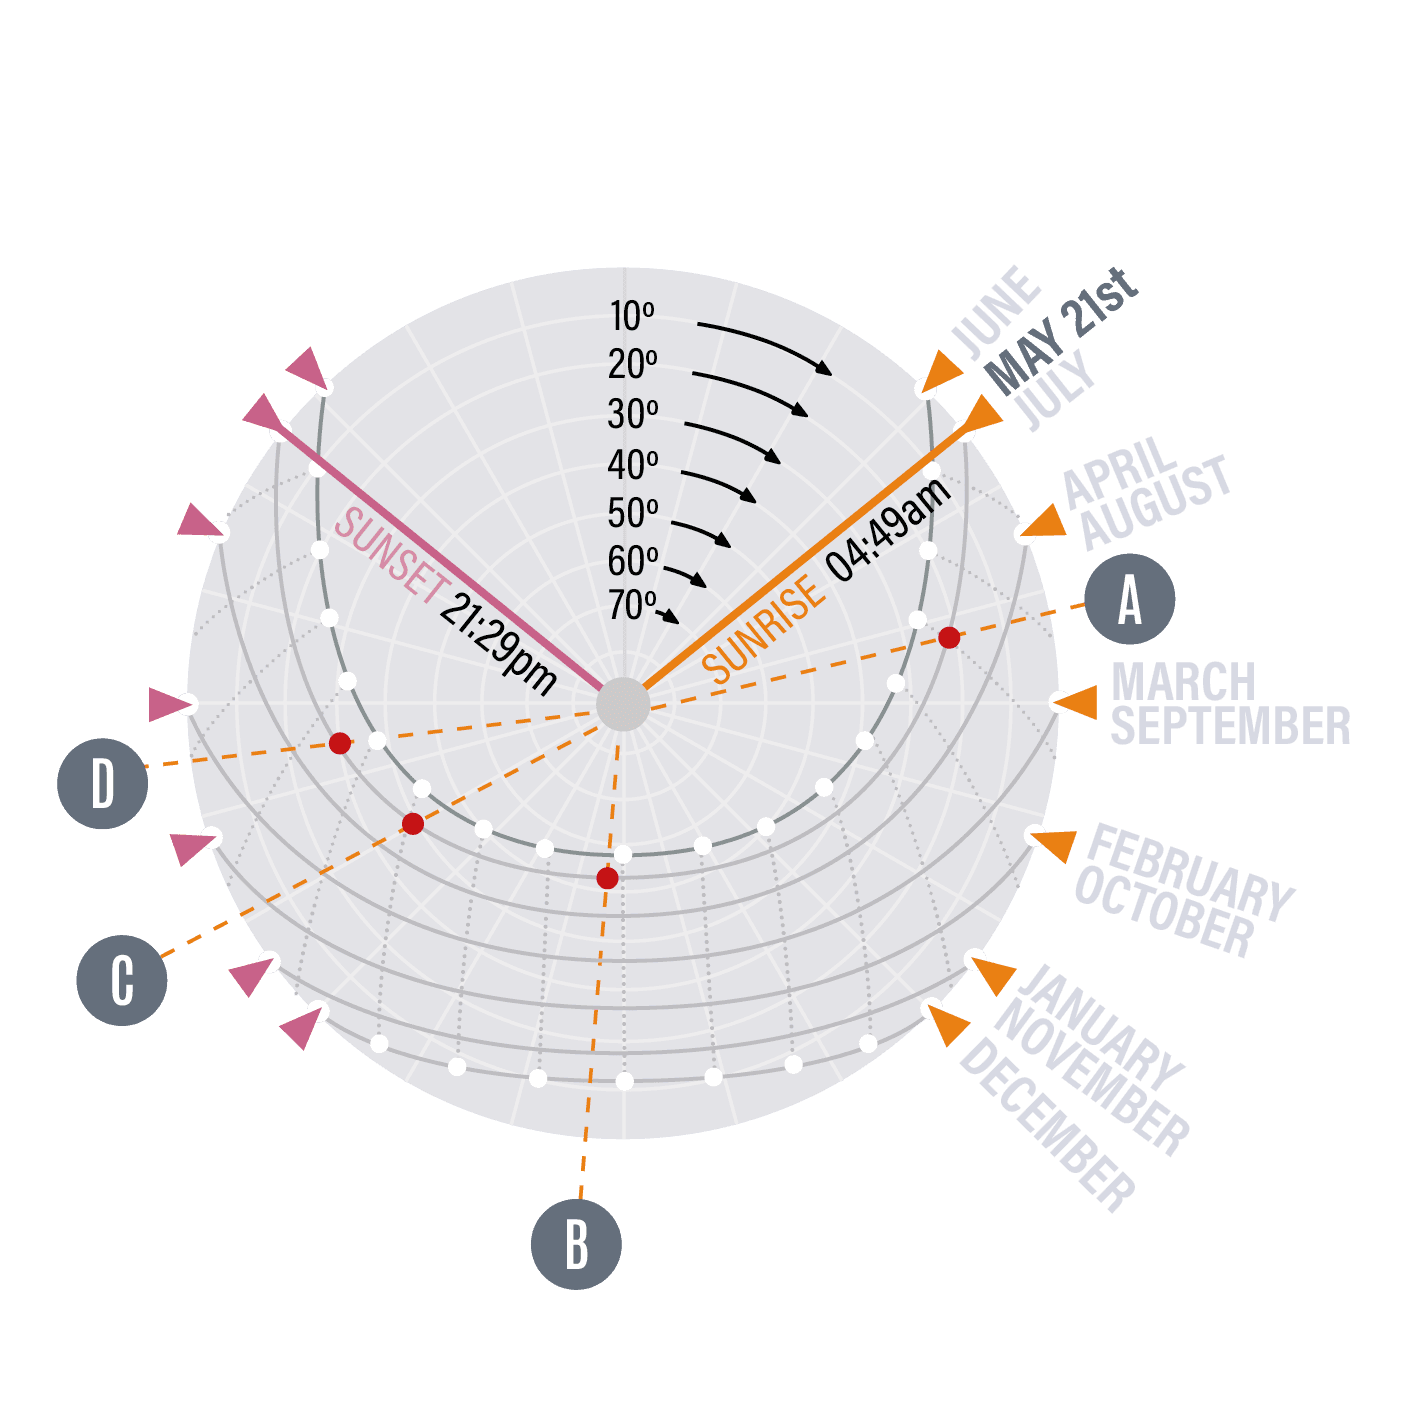
Showing a line for the rest of the months we can intersect the angle of the sun throughout the day to give a relative height of the sun at that time.
21 May
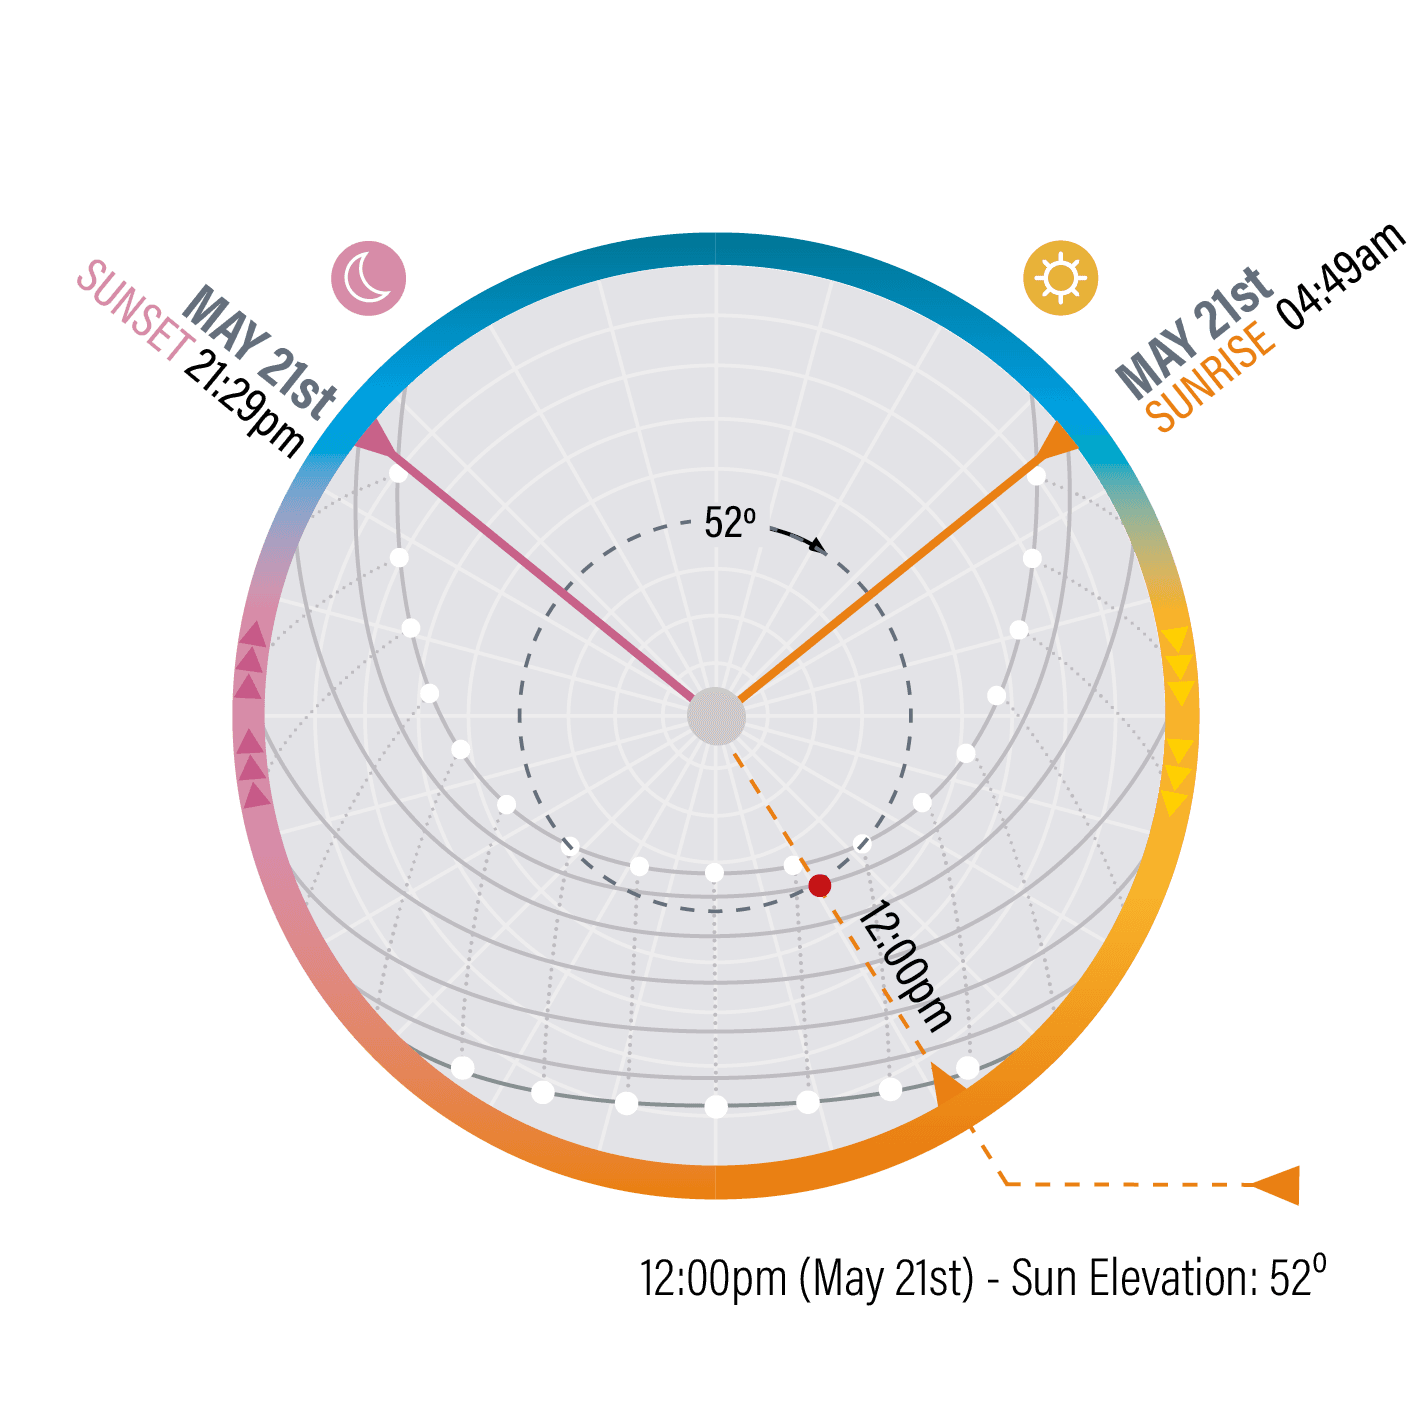
It's not an exact science using this complex tool simply because it is only 5cm wide on the printed page, but by having an ephemeris on every spread and location page like this we can, within a margin, obtain an understanding of the direction and height of the sun at any time of any day during the year. If we know where light is coming from, then we can work out how it might affect our image.
21 May
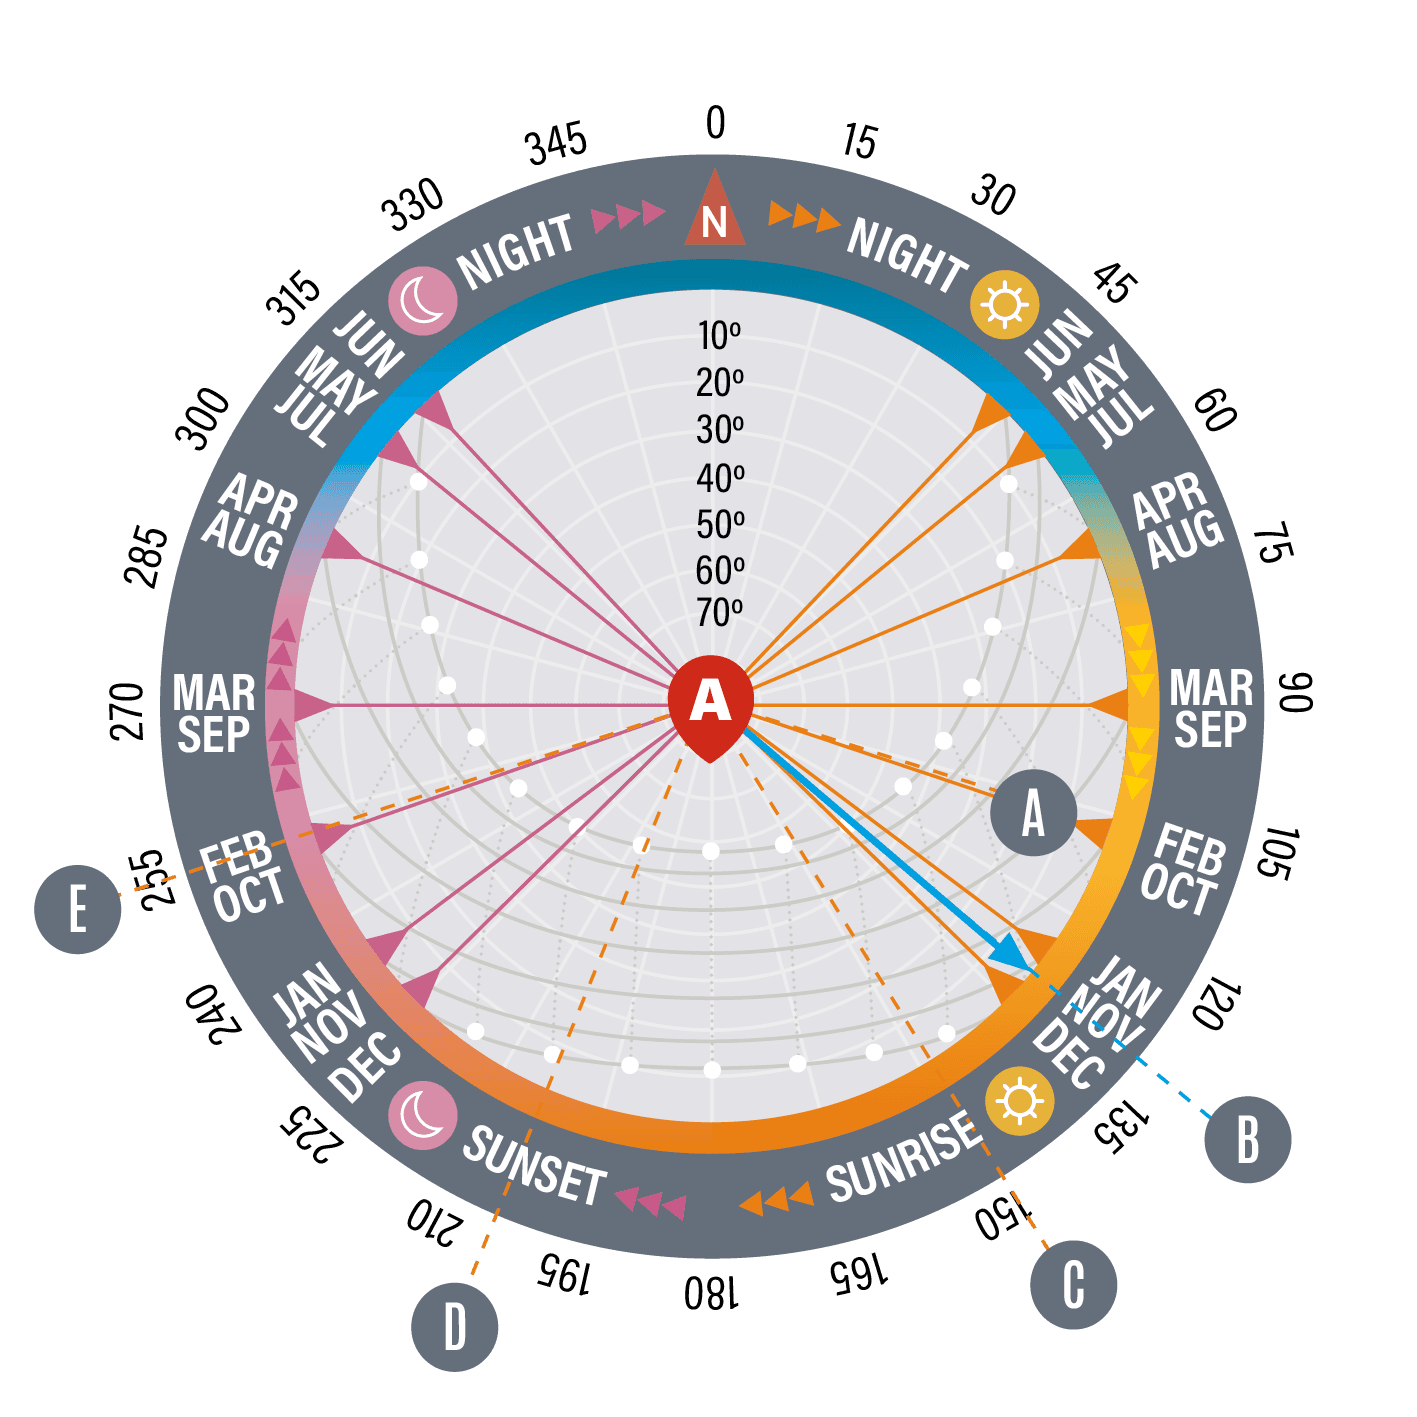
If we put all the elements together and apply the photo direction for the image below with a map we can start to see it all in more context.
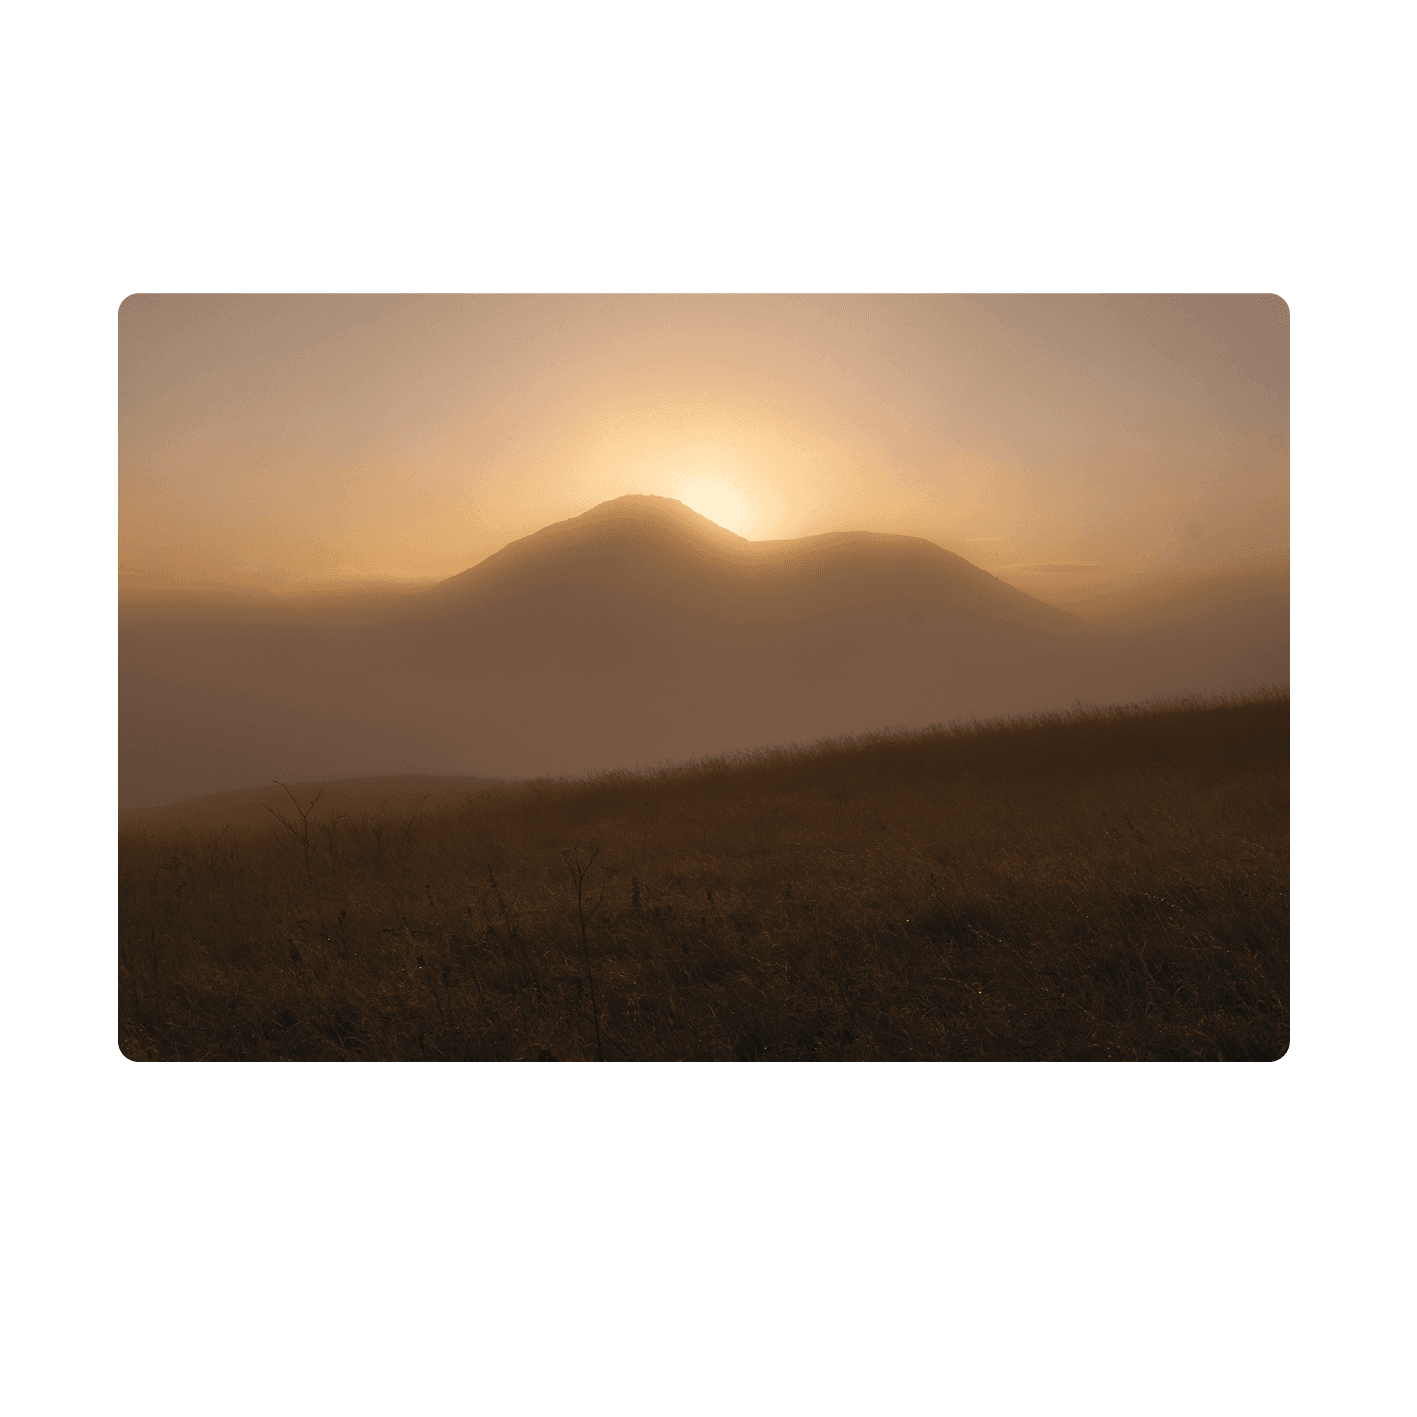
Photo below taken on 20th of October at 8:30am.
20 October
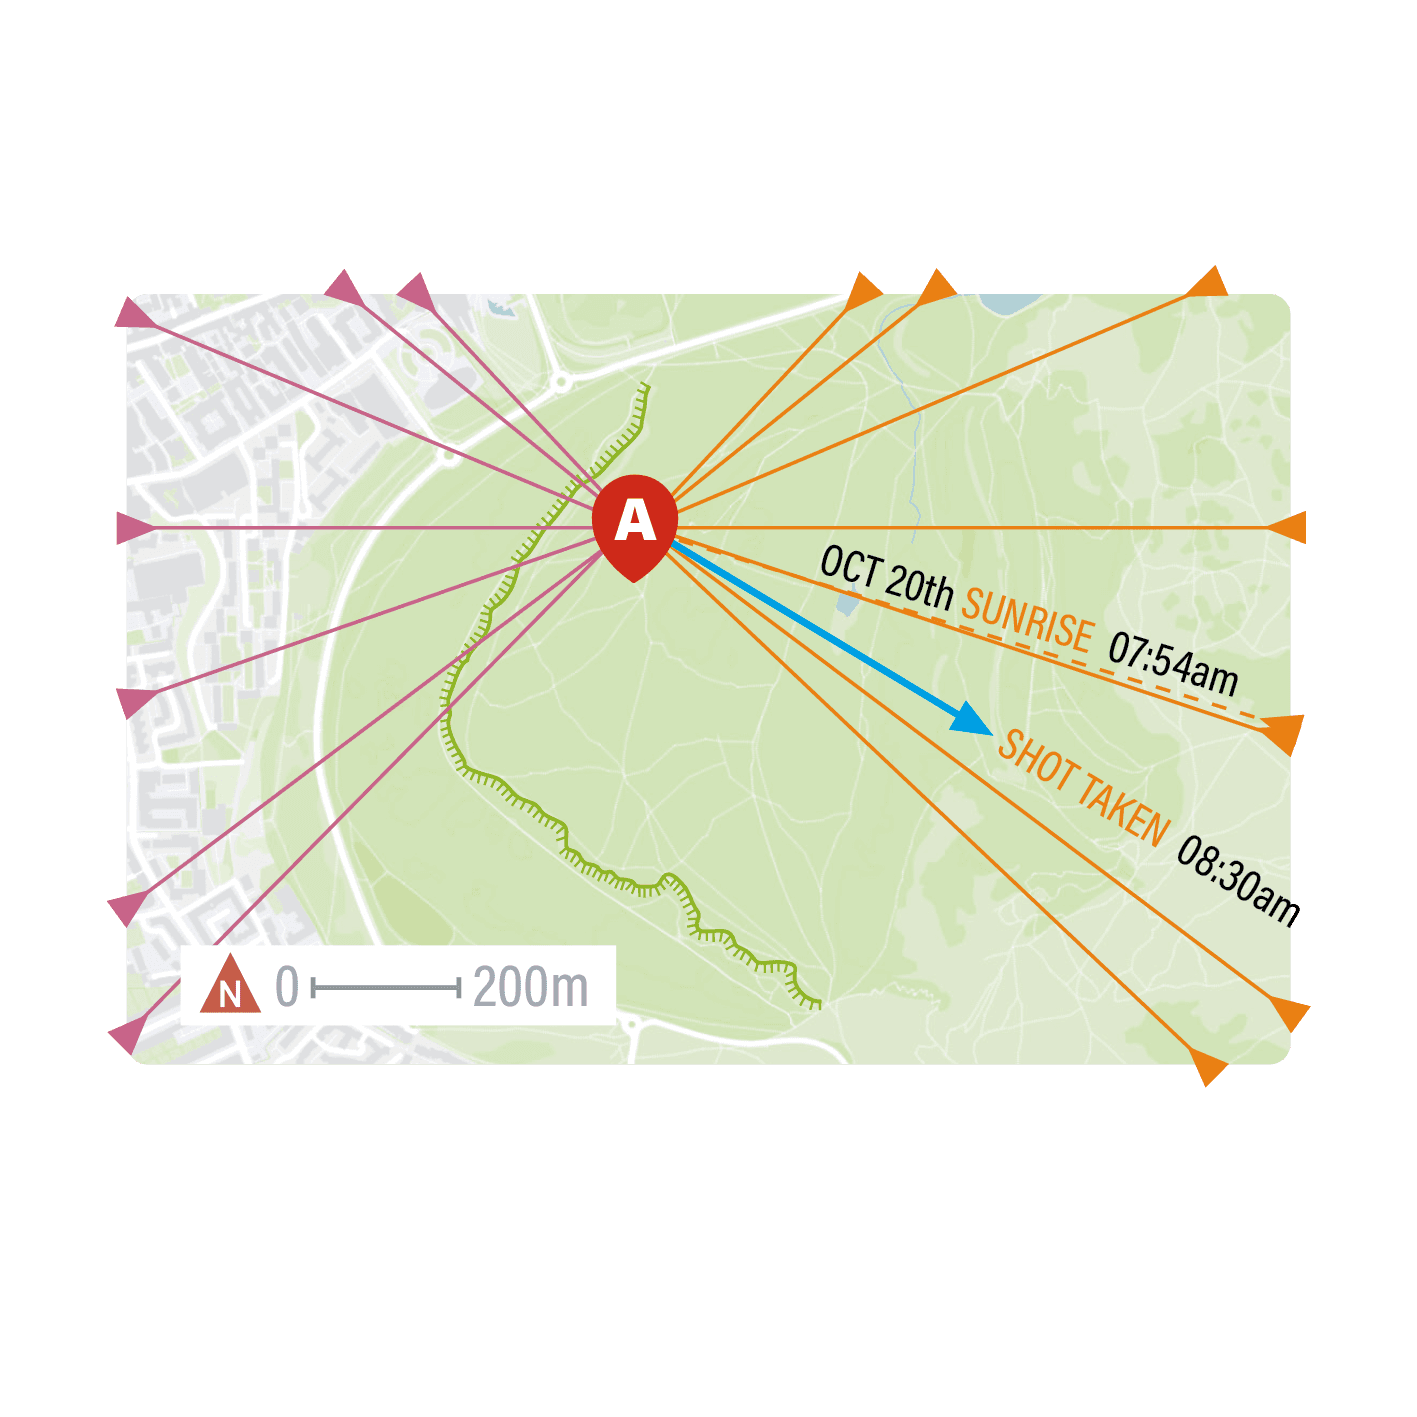
Visualising the direction of light over the map helps us understand where the light was, or will be, in any location.
Note: The sun appears to be just rising above the horizon in this image due to the height of the hill. It is in fact taken around 35 minutes after sunrise with the sun at around 4 degrees of elevation.
See it live
Pick any location, choose a date, and the map shows where the sun rises, sets and sits at any hour of the day.